- Strong first quarter average production of 29,407 boe/d; current production further grew to 33,000 boe/d based on recent drilling success
- Active first half four-rig drilling program with 19 operated wells (18.5 net) rig-released in the quarter and 14 wells (13.5 net) now on production
- Strong production rates from new Peace River wells from late 2021 and early 2022 programs
- 2022 production range further increased by 200 boe/d to between 30,300 to 31,300 boe/d
- Funds flow from operations was $101.3 million in the quarter, excluding $22.7 million of share-based compensation charges
- New member appointed to the Board of Directors
Oil & Gas Permit Download
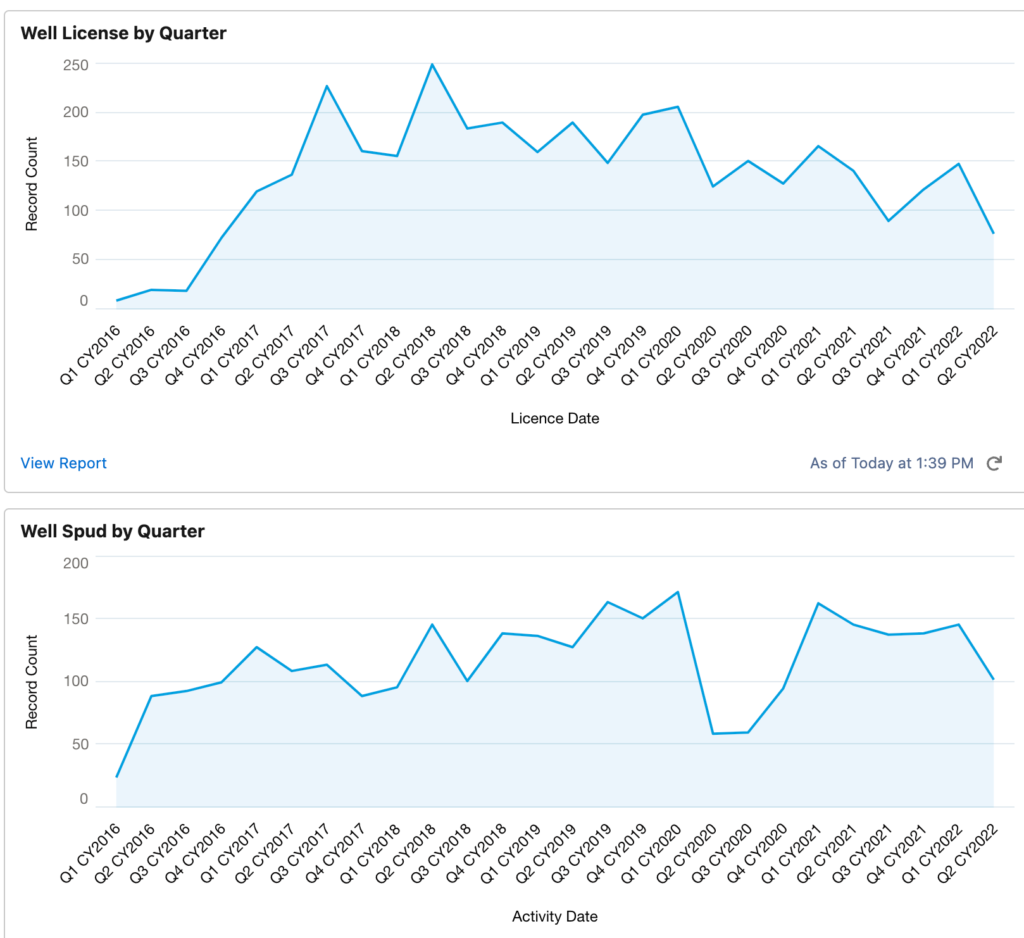
Obsidian Wells Drilled Since 2020
Obsidian Facility Permits Since 2020
Well Permit Summary
Calgary, Alberta–(Newsfile Corp. – May 4, 2022) – OBSIDIAN ENERGY LTD. (TSX: OBE) (NYSE American: OBE) (“Obsidian Energy“, the “Company“, “we“, “us” or “our“) is pleased to report operating and financial results for the first quarter of 2022.
Three Months Ended
March 312022 2021 FINANCIAL1
(millions, except per share amounts)Cash flow from operating activities 83.9 28.4 Basic per share ($/share)2 1.03 0.39 Diluted per share ($/share)2 1.00 0.37 Funds flow from operations3 78.6 36.3 Basic per share ($/share)4 0.97 0.49 Diluted per share ($/share)4 0.94 0.48 Net income 23.8 23.2 Basic per share ($/share) 0.29 0.32 Diluted per share ($/share) 0.28 0.31 Capital expenditures 103.4 29.5 Decommissioning expenditures 8.5 3.3 Long-term debt 368.4 439.9 Net debt3 448.8 455.0 OPERATIONS Daily Production Light oil (bbl/d) 11,114 10,014 Heavy oil (bbl/d) 5,789 2,788 NGL (bbl/d) 2,432 2,056 Natural gas (mmcf/d) 60 50 Total production5 (boe/d) 29,407 23,225 Average sales price6 Light oil ($/bbl) 117.91 67.34 Heavy oil ($/bbl) 84.77 40.48 NGL ($/bbl) 68.09 41.04 Natural gas ($/mcf) 4.96 3.21 Netback ($/boe) Sales price 77.07 44.21 Risk management gain (loss) (6.58 ) (2.44 ) Net sales price 70.49 41.77 Royalties (11.35 ) (2.68 ) Net operating costs4 (13.93 ) (13.52 ) Transportation (2.76 ) (1.79 ) Netback4 ($/boe) 42.45 23.78
Energy News