
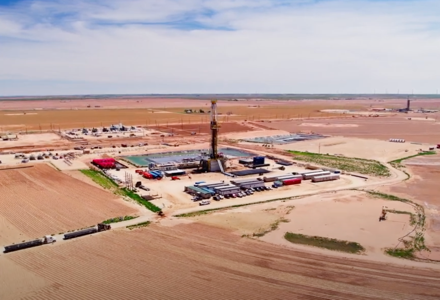
According to Enverus average drilling and completion (D&C) costs are moving in different directions across US operator groups, according to Enverus PRISM data covering Lower-48 well vintages from 2020 through 2026. Large-cap operators maintained relatively stable spending per well, while mid-cap operators recorded an approximately 18% increase—highlighting differences in development programs and purchasing conditions across the market.
Large-cap operators averaged approximately $7.6 million to $7.9 million per well throughout the seven-year period. Mid-cap costs increased from roughly $7.4 million in 2020 to $8.8 million in 2026. Majors rose from approximately $7.2 million in 2021 to $8.0 million in 2026, slightly exceeding the large-cap average.
Micro-cap operators reported the highest average costs, at approximately $9.0 million to $9.3 million per well since 2022. Small-cap and private equity-backed operators generally recorded the lowest averages, between $6.2 million and $7.0 million. The difference between the highest- and lowest-cost groups reached approximately $2.4 million per well in 2025.
These figures measure spending per well rather than cost per foot or production performance. Longer laterals, deeper targets and more intensive completions can increase total well costs without indicating weaker execution. Operators, investors and suppliers should compare similar wells before attributing differences to service pricing or operating efficiency.
Operator group Average D&C cost per well Key trend Large caps $7.6–$7.9 million Stayed within roughly $300,000 across seven years Majors $7.2 million in 2021 → ~$8.0 million in 2026 Gradually increased, moving above large caps Mid caps $7.4 million in 2020 → ~$8.8 million in 2026 Increased approximately 18% Micro caps $9.0–$9.3 million since 2022 Consistently recorded the highest averages PE-backed operators and small caps Generally $6.2–$7.0 million Consistently among the lowest averages
Industry Impact
For North American oilfield service (OFS) companies, the findings show why a single market-wide cost assumption can misrepresent customer economics. Cost control supports the US role as a “safe barrel” supplier—a source of oil backed by established infrastructure and dependable commercial relationships—but these figures alone do not establish supply reliability or profitability.
Two-Sentence Summary
Enverus data shows mid-cap drilling and completion costs increased approximately 18% from 2020 to 2026, while large-cap averages remained between $7.6 million and $7.9 million per well. OFS suppliers should tailor proposals to operator programs and compare equivalent well designs before drawing conclusions about cost

Author: phinds