
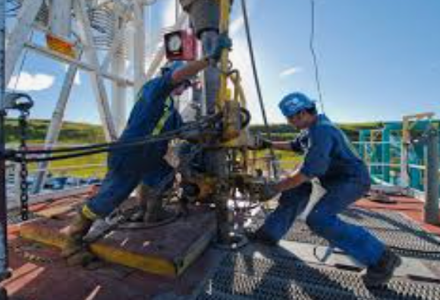
Patterson-UTI expects U.S. onshore drilling activity to strengthen further in 2027, with larger public operators likely to account for a significant share of the next round of rig additions. Speaking during its October 29, 2026 earnings call, management said private operators led the initial recovery, while discussions and contracts with public companies are now supporting continued growth.

The company’s operating rig count increased from 88 at the April low to 104, reflecting stronger customer demand. Patterson averaged 101 operating rigs during the third quarter and expects approximately 104 in the fourth quarter, with its count finishing the year above that level. Management expects overall industry activity to remain relatively steady through the fourth quarter before customer budget resets support another increase in 2027.
Higher Rig Rates and Demand for Advanced Equipment
The recovery is also improving pricing. Patterson said average rig day rates increased from the low $30,000s earlier in the year to the mid $30,000s, with upgraded rigs earning several thousand dollars above the company average.
Operators are seeking larger rigs capable of drilling longer laterals and deeper wells, along with automation, digital systems, AI capabilities and equipment that can use natural gas as fuel. Management said these requirements are widening the performance gap between premium rigs and older equipment.
Available capacity could limit how quickly the industry responds. Patterson identified approximately 8–10 additional rigs that could economically return to work at current pricing. Beyond those units, further reactivations would require substantially higher investment and stronger pricing. International demand is also drawing rigs out of the United States, adding pressure to domestic supply.
Oil Drilling Outlook Stronger; Natural Gas Activity Stable
Management expects oil-directed drilling to strengthen into 2027, supported by forward oil prices above the levels customers used to prepare their 2026 budgets. Some rig deployments extending into mid-2027 are already supported by signed contracts.
The near-term outlook for natural gas drilling is less certain. Patterson said its Northeast and Haynesville activity remained stable despite commodity-price volatility. It believes demand for advanced equipment could support additional company activity even if overall gas-basin drilling remains relatively unchanged.
Source:
Patterson’s 2026 YTD Drilling Footprint
OilGasLeads’ supplied Patterson dataset contains 1,530 well activity records, covering January 1 through October 26, 2026, across 12 states and 67 accounts.
These records describe Patterson’s customer and geographic footprint during the reporting period. They are separate from the company’s operating rig count and are counted as supplied, without deduplication.
Record Count by State
New Mexico and Texas account for 692 records, representing 45.2% of the dataset.
State Record count New Mexico 361 Texas 331 Pennsylvania 174 North Dakota 145 Ohio 138 Oklahoma 95 Utah 83 Colorado 81 West Virginia 41 Wyoming 31 Montana 27 Louisiana 23 Total 1,530
Record Count by Play/Basin
The Permian Basin leads with 561 records, representing 36.7% of the total. Appalachia follows with 353 records, or 23.1%, while the Williston Basin accounts for 172 records, or 11.2%.
Play/basin grouping Record count Permian Basin 561 Appalachian Basin — Marcellus / Utica region 353 Williston Basin — Bakken region 172 South Texas — Eagle Ford / Austin Chalk region 87 Anadarko Basin — western Oklahoma / SCOOP-STACK region 84 Uinta Basin 83 Denver-Julesburg Basin — Niobrara region 81 East Texas / North Louisiana — Haynesville region 42 Powder River Basin 31 Central Texas — Austin Chalk / Eagle Ford region 25 Southern Oklahoma — Ardmore / Bryan / adjacent areas 10 Arkoma Basin 1 Total 1,530
Basin and play groupings are geographic classifications inferred from county and state. Counties can contain multiple producing formations, so these groupings do not confirm each well’s target formation.
Top 10 Accounts by Record Count
Mewbourne Oil Company leads with 236 records, followed by Chevron with 143 and Matador Resources with 112. Together, the top 10 accounts represent 992 records, or 64.8% of the dataset.
Rank Account Record count 1 Mewbourne Oil Company 236 2 Chevron U.S.A. Inc. 143 3 Matador Resources Company 112 4 EQT Corporation 96 5 Continental Resources 79 6 Phoenix Energy 76 7 EOG Resources, Inc. 67 8 Chord Energy Corporation 63 9 SM Energy Company (Civitas) 61 10 Ascent Resources 59 Top 10 total 992
Account names are reproduced as recorded in the supplied dataset.
Data source:
Industry Impact
For oilfield service companies and suppliers, Patterson’s outlook suggests opportunities from additional drilling programs and investment in higher-capability equipment. Its YTD records show the largest concentration of activity in the Permian, Appalachia and Williston regions. As public operators prepare their next round of rig additions, suppliers can use operator-level activity and permit intelligence to identify where demand for drilling tools, equipment, field services and supporting infrastructure may develop.

Author: phinds