Using our proprietary data collection/preparation technology we create original content about oil & gas drilling activity, drilling rigs, facility and pipeline construction projects in North America.
Social Platform – we have 11000 plus linkedin connection that are in the oil & gas industry. We are adding 100’s of new connection a week. A typical oil & gas infographic post gets 5000 views. We commit to no less that 3 branded linkedin posts a day.
Linkedin Content Marketing Samples
We primary use infographic is a collection of of oil & gas imagery, charts, and minimal text that gives an easy-to-understand overview of a topic. We brand the oil & gas infographic with your company logo.
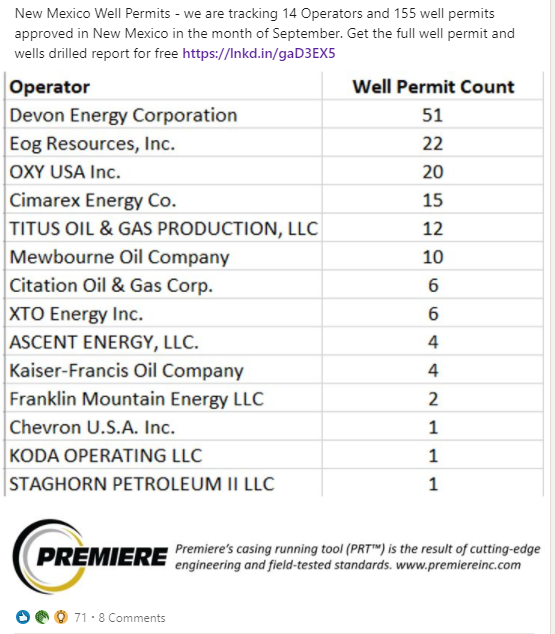
Top Lists
Lists are the most successful post examples include; who drill the most wells, who has the most well permits; who has the most gas plants, who has the mots pipeline.
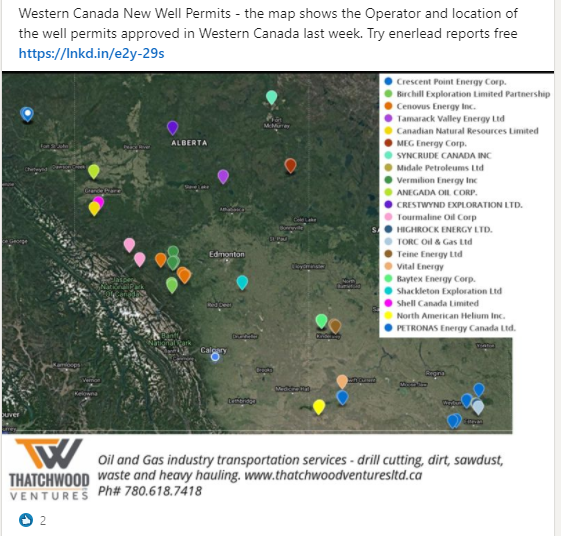
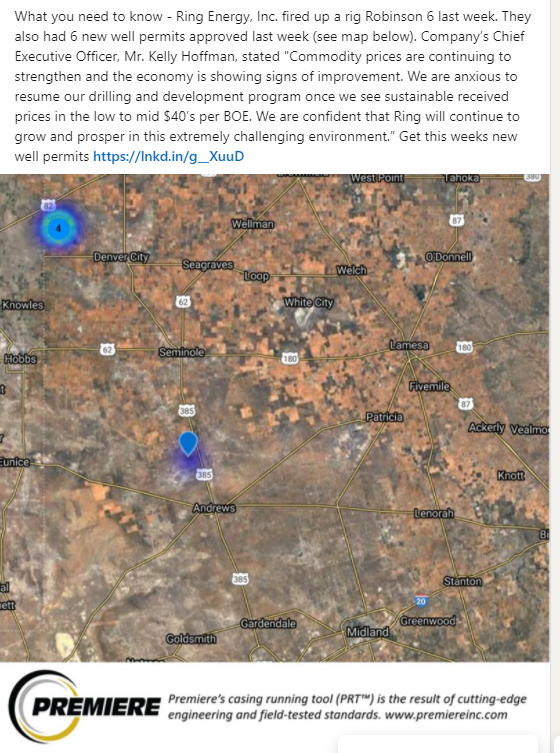
Maps
People love maps it helps them find the data they are looking for quickly. Maps provide the same type of data in a list, but displayed in a map and not a table.
What you need to know
This is account specific information that we have identified as part of our data analytics
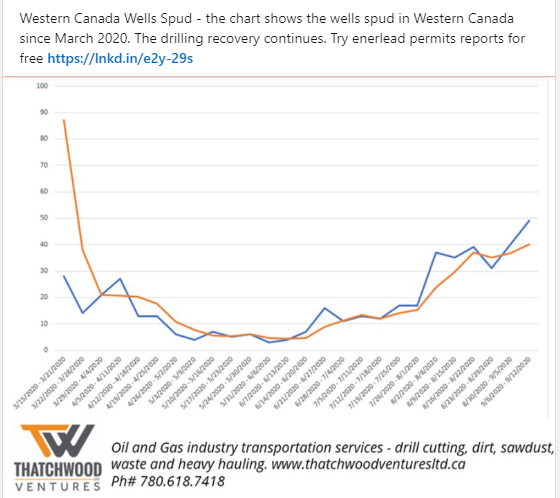
Industry Trends
We use the data collected to identify an industry trend they include; new well permits, wells spud, facility and pipeline construction.