
SPRING, Texas–(BUSINESS WIRE)– Southwestern Energy Company (NYSE: SWN) (the “Company” or “Southwestern Energy”) today announced financial and operating results for the fourth quarter and full-year 2023.
Oil & Gas Data Download
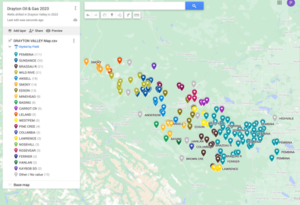
Southwestern Energy Company Wells Drilled 2023
2023 Highlights
- Generated $2.5 billion net cash provided by operating activities, $1.6 billion net income and $744 million adjusted net income (non-GAAP)
- Adjusted EBITDA (non-GAAP) of $2.4 billion and free cash flow (non-GAAP) of $142 million
- Ended the year with total debt of $4.0 billion, including the impacts of working capital
- Produced 1.7 Tcfe, or 4.6 Bcfe per day, including 3.9 Bcf per day of natural gas and 105 MBbls per day of liquids
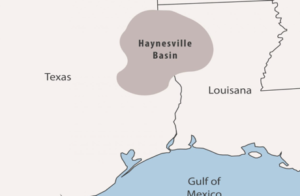
- Invested $2.1 billion of capital and placed 132 wells to sales, including 67 in Appalachia and 65 in Haynesville
2023 Fourth Quarter and Full Year Results
FINANCIAL STATISTICS For the three months ended For the years ended December 31, December 31, (in millions) 2023 2022 2023 2022 Net income (loss) $ (658 ) $ 2,901 $ 1,557 $ 1,849 Adjusted net income (non-GAAP)2 $ 192 $ 287 $ 744 $ 1,479 Diluted earnings (loss) per share $ (0.60 ) $ 2.63 $ 1.41 $ 1.66 Adjusted diluted earnings per share (non-GAAP) $ 0.17 $ 0.26 $ 0.67 $ 1.33 Adjusted EBITDA (non-GAAP) $ 611 $ 732 $ 2,407 $ 3,283 Net cash provided by operating activities $ 477 $ 958 $ 2,516 $ 3,154 Net cash flow (non-GAAP) $ 579 $ 677 $ 2,273 $ 3,057 Total capital investments (1) $ 417 $ 537 $ 2,131 $ 2,209 Free cash flow (non-GAAP) $ 162 $ 140 $ 142 $ 848 (1) Capital investments on the cash flow statement include an increase of $78 million and an increase of $44 million for the three months ended December 31, 2023 and 2022, respectively, and a decrease of $44 million and an increase of $88 million for the years ended December 31, 2023 and 2022, respectively, relating to the change in accrued expenditures between periods.
Fourth Quarter 2023 Financial Results
For the quarter ended December 31, 2023, Southwestern Energy recorded a net loss of $658 million, or ($0.60) per diluted share. Adjusting for the impact of the Company’s full cost ceiling test impairment, gain on unsettled derivatives, and other one-time items, adjusted net income (non-GAAP) was $192 million, or $0.17 per diluted share, and adjusted EBITDA (non-GAAP) was $611 million. Net cash provided by operating activities was $477 million, net cash flow (non-GAAP) was $579 million, and free cash flow (non-GAAP) was $162 million.
As indicated in the table below, fourth quarter 2023 weighted average realized price, including $0.26 per Mcfe of transportation expenses, was $2.51 per Mcfe, excluding the impact of derivatives. Including derivatives, the weighted average realized price for the quarter decreased 5% from $2.88 per Mcfe in 2022 to $2.75 per Mcfe in 2023 primarily due to lower commodity prices, including a 54% decrease in NYMEX and a 5% decrease in WTI, partially offset by the impact of settled derivatives. Fourth quarter 2023 weighted average realized price before transportation expense and excluding derivatives was $2.77 per Mcfe.
Full Year 2023 Financial Results
For the year ended December 31, 2023, the Company recorded net income of $1,557 million, or $1.41 per diluted share. Adjusting for the impact of the Company’s full cost ceiling test impairment, gain on unsettled derivatives, and other one-time items, adjusted net income (non-GAAP) was $744 million, or $0.67 per diluted share, and adjusted EBITDA (non-GAAP) was $2,407 million. Net cash provided by operating activities was $2,516 million, net cash flow (non-GAAP) was $2,273 million, and free cash flow (non-GAAP) was $142 million.
In 2023, the Company primarily utilized free cash flow generated and proceeds from non-core asset divestitures to reduce its debt balance. As of December 31, 2023, Southwestern Energy had total debt of $4.0 billion and net debt to adjusted EBITDA (non-GAAP) of 1.6x. This compares to total debt of $4.4 billion as of December 31, 2022. At the end of 2023, the Company had $220 million of borrowings under its revolving credit facility and no outstanding letters of credit.
As indicated in the table below, for the full year 2023, weighted average realized price, including $0.26 per Mcfe of transportation expenses, was $2.46 per Mcfe, excluding the impact of derivatives. Including derivatives, the weighted average realized price for the quarter was down 13% from $3.06 per Mcfe in 2022 to $2.67 per Mcfe in 2023 primarily due to lower commodity prices, including a 59% decrease in NYMEX and an 18% decrease in WTI, partially offset by the impact of settled derivatives. In 2023, the weighted average realized price before transportation expense and excluding derivatives was $2.72 per Mcfe.
Realized Prices For the three months ended For the years ended (includes transportation costs) December 31, December 31, 2023 2022 2023 2022 Natural Gas Price: NYMEX Henry Hub price ($/MMBtu) (1) $ 2.88 $ 6.26 $ 2.74 $ 6.64 Discount to NYMEX (2) (0.74 ) (0.79 ) (0.63 ) (0.66 ) Average realized gas price, excluding derivatives ($/Mcf) $ 2.14 $ 5.47 $ 2.11 $ 5.98 Gain on settled financial basis derivatives ($/Mcf) 0.09 0.17 0.03 0.08 Gain (loss) on settled commodity derivatives ($/Mcf) 0.20 (2.98 ) 0.22 (3.27 ) Average realized gas price, including derivatives ($/Mcf) $ 2.43 $ 2.66 $ 2.36 $ 2.79 Oil Price: WTI oil price ($/Bbl) (3) $ 78.32 $ 82.65 $ 77.62 $ 94.23 Discount to WTI (4) (10.77 ) (7.71 ) (10.78 ) (7.28 ) Average realized oil price, excluding derivatives ($/Bbl) $ 67.55 $ 74.94 $ 66.84 $ 86.95 Average realized oil price, including derivatives ($/Bbl) $ 57.21 $ 46.15 $ 57.21 $ 50.83 NGL Price: Average realized NGL price, excluding derivatives ($/Bbl) $ 21.96 $ 25.52 $ 21.38 $ 34.35 Average realized NGL price, including derivatives ($/Bbl) $ 23.00 $ 23.40 $ 22.46 $ 26.52 Percentage of WTI, excluding derivatives 28 % 31 % 28 % 36 % Total Weighted Average Realized Price: Excluding derivatives ($/Mcfe) $ 2.51 $ 5.45 $ 2.46 $ 6.10 Including derivatives ($/Mcfe) $ 2.75 $ 2.88 $ 2.67 $ 3.06 (1) Based on last day settlement prices from monthly futures contracts. (2) This discount includes a basis differential, a heating content adjustment, physical basis sales, third-party transportation charges and fuel charges, and excludes financial basis hedges. (3) Based on the average daily settlement price of the nearby month futures contract over the period. (4) This discount primarily includes location and quality adjustments.
Operational Results
Total production for the quarter ended December 31, 2023 was 410 Bcfe, comprised of 86% natural gas, 12% NGLs and 2% oil. Production totaled 1.7 Tcfe for the year ended December 31, 2023.
Capital investments in the fourth quarter of 2023 were $417 million, bringing full year capital investment to $2,131 million. The Company brought 132 wells to sales, drilled 110 wells and completed 124 wells during the year.
For the three months ended For the years ended December 31, December 31, 2023 2022 2023 2022 Production Gas production (Bcf) 352 372 1,438 1,520 Oil production (MBbls) 1,433 1,187 5,602 4,993 NGL production (MBbls) 8,144 8,001 32,859 30,446 Total production (Bcfe) 410 427 1,669 1,733 Average unit costs per Mcfe Lease operating expenses (1) $ 1.09 $ 1.00 $ 1.05 $ 0.98 General & administrative expenses (2) $ 0.10 $ 0.10 $ 0.10 $ 0.09 Taxes, other than income taxes $ 0.13 $ 0.16 $ 0.15 $ 0.15 Full cost pool amortization $ 0.79 $ 0.72 $ 0.77 $ 0.67 (1) Includes post-production costs such as gathering, processing, fractionation and compression. (2) Excludes $27 million in merger-related expenses for the year ended December 31, 2022.
Appalachia – In the fourth quarter, total production was 264 Bcfe, with NGL production of 88 MBbls per day and oil production of 15 MBbls per day. The Company drilled 9 wells, completed 5 wells, and placed 11 wells to sales with an average lateral length of 13,514 feet.
In 2023, Appalachia’s total production was 1.0 Tcfe, including 105 MBbls per day of liquids. During 2023, the Company drilled 60 wells, completed 63 wells, and placed 67 wells to sales, with an average lateral length of 15,978 feet. At year-end, the Company had 17 drilled but uncompleted wells in Appalachia.
Haynesville – In the fourth quarter, total production was 146 Bcf. There were 8 wells drilled, 12 wells completed, and 12 wells placed to sales in the quarter with an average lateral length of 8,739 feet.
Production for the year was 635 Bcf in Haynesville. The Company drilled 50 wells, completed 61 wells, and brought 65 wells to sales, with an average lateral length of 8,532 feet. The Company had 13 drilled but uncompleted wells at year-end in Haynesville.
E&P Division Results For the three months
ended December 31, 2023 For the year ended
December 31, 2023 Appalachia Haynesville Appalachia Haynesville Gas production (Bcf) 206 146 803 635 Liquids production Oil (MBbls) 1,422 9 5,568 30 NGL (MBbls) 8,141 2 32,848 9 Production (Bcfe) 264 146 1,034 635 Capital investments ($ in millions) Drilling and completions, including workovers $ 107 $ 215 $ 726 $ 1,053 Land acquisition and other 15 3 89 8 Capitalized interest and expense 32 19 123 77 Total capital investments $ 154 $ 237 $ 938 $ 1,138 Gross operated well activity summary Drilled 9 8 60 50 Completed 5 12 63 61 Wells to sales 11 12 67 65 Total weighted average realized price per Mcfe, excluding derivatives $ 2.47 $ 2.58 $ 2.46 $ 2.46 Wells to sales summary For the three months ended
December 31, 2023 For the year ended
December 31, 2023 Gross wells
to sales Average
lateral length Gross wells
to sales Average
lateral length Appalachia Super Rich Marcellus 2 15,543 30 16,096 Rich Marcellus 3 9,677 16 14,223 Dry Gas Utica — — 5 17,769 Utica Condensate 3 20,962 3 20,962 Dry Gas Marcellus 3 8,551 13 16,028 Haynesville 12 8,739 65 8,532 Total 23 132
2023 Proved Reserves
The Company reported total proved reserves of 19.7 Tcfe at year-end 2023, down from 21.6 Tcfe at year-end 2022, primarily due to downward price revisions.
The after-tax PV-10 (standardized measure) of the Company’s reserves was $7.3 billion. The PV-10 value before the impact of taxes (non-GAAP) was $7.8 billion, including $6.5 billion from Appalachia and $1.3 billion from Haynesville. SEC prices used for the Company’s reported 2023 reserves were $2.64 per Mcf NYMEX Henry Hub, $78.22 per Bbl WTI, and $21.38 per Bbl NGLs.
Proved Reserves Summary For the years ended December 31, 2023 2022 Proved reserves (in Bcfe) 19,660 21,625 PV-10: (in millions) Pre-tax $ 7,796 $ 46,435 PV of taxes (483 ) (8,847 ) After-tax (in millions) $ 7,313 $ 37,588 Percent of estimated proved reserves that are: Natural gas 78 % 80 % NGLs and oil 22 % 20 % Proved developed 59 % 56 % 2023 Proved Reserves by Division (Bcfe) Appalachia Haynesville Total Proved reserves, beginning of year 15,666 5,959 21,625 Price revisions (570 ) (1,277 ) (1,847 ) Performance revisions 246 (70 ) 176 Infill revisions 1,200 34 1,234 Changes in development plan (1,257 ) (278 ) (1,535 ) Performance and production revisions 189 (314 ) (125 ) Extensions, discoveries and other additions 783 1,243 2,026 Production (1,034 ) (635 ) (1,669 ) Acquisition of reserves in place — — — Disposition of reserves in place (349 ) (1 ) (350 ) Proved reserves, end of year 14,685 4,975 19,660
The Company reported 2023 proved developed finding and development (“PD F&D”) costs of $0.91 per Mcfe when excluding the impact of capitalized interest and portions of capitalized general & administrative costs in accordance with the full cost method of accounting. The 2023 PD F&D for Appalachia was $0.66 per Mcfe and Haynesville was $1.27 per Mcfe.
Proved Developed Finding and Development (1) 12 Months Ended
December 31,Total PD Adds (Bcfe): 2023 New PD adds 80 PUD conversions 1,959 Total PD Adds 2,039 Costs Incurred (in millions): Unproved property acquisition costs $ 184 Exploration costs — Development costs 1,939 Capitalized Costs Incurred $ 2,123 Subtract (in millions): Proved property acquisition costs $ — Unproved property acquisition costs (184 ) Capitalized interest and expense associated with development and exploration (2) (85 ) PD Costs Incurred $ 1,855 PD F&D (PD Cost Incurred / Total PD Adds) $ 0.91 Note: Amounts may not add due to rounding (1) Includes Appalachia and Haynesville. (2) Adjusting for the impacts of the full cost accounting method for comparability.
Guidance
Due to the pending merger with Chesapeake Energy Corporation, Southwestern Energy has discontinued providing guidance. Accordingly, investors are cautioned not to rely on historical forward-looking statements as those forward-looking statements were the estimates of management only as of the date provided and were subject to the specific risks and uncertainties that accompanied such forward-looking statements.
Conference Call
Due to the pending merger with Chesapeake Energy Corporation (“Chesapeake”), Southwestern Energy will not host a conference call or webcast to discuss its fourth quarter and full year 2023 results.
Oil & Gas Account Download


Author: phinds