
HOUSTON, Feb. 22, 2024 EOG Resources, Inc. (EOG) today reported fourth quarter and full-year 2023 results. The attached supplemental financial tables and schedules for the reconciliation of non-GAAP measures to GAAP measures and related definitions, along with a related presentation, are also available on EOG’s website at http://investors.eogresources.com/investors.
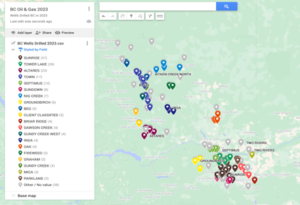
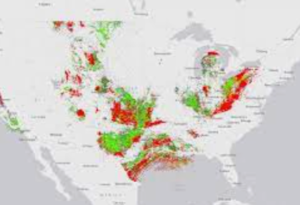
Oil & Gas Data Download
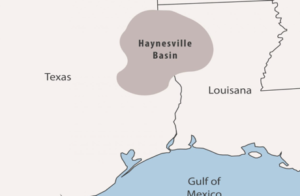
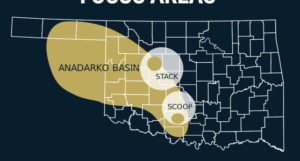
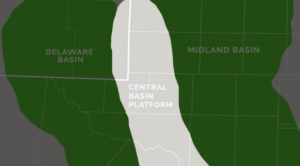
EOG Wells Drilled 2023
Fourth Quarter Highlights
- Earned adjusted net income of $1.8 billion, or $3.07 per share
- Generated $1.5 billion of free cash flow
- Declared regular quarterly dividend of $0.91 per share and repurchased $300 million of shares
- Volumes and per-unit operating costs beat guidance midpoints
- Entered into a 10-year Brent-linked gas sales agreement starting in January 2027
Full-Year 2023 Highlights and 2024 Capital Plan
- Generated $5.1 billion of free cash flow and returned $4.4 billion to shareholders
- Delivered oil and total volumes on target and reduced per-unit cash operating costs and DD&A
- Announced $6.2 billion capital plan to grow oil production 3% and total production 7%
From Ezra Yacob, Chairman and Chief Executive Officer
“EOG continues to deliver on its value proposition as demonstrated by our strong execution in 2023. Oil and total volumes were on target, capital expenditures on budget, and we further lowered operating costs. Each of the teams working across our multi-basin portfolio championed the EOG culture and played an important role in delivering another successful year.
“The ability to manage investment and pace of activity at the appropriate level for each of our plays was critical to our success in 2023. We lowered the overall cost basis of the company by balancing activity between foundational assets and emerging plays. Progress across our portfolio, including continued improvement in Delaware Basin productivity, successful delineation results in the Utica play, and advancements across several exploration areas, provides opportunity for further improvement going forward.
“EOG’s operating results drove our financial performance. EOG earned strong return on capital, while generating $5.1 billion of free cash flow. Cash return to shareholders of $4.4 billion was well above our prior minimum 60% commitment and continues to be anchored by our sustainable, growing regular dividend. The financial strength of the company, including our cash flow generation capacity and our industry-leading balance sheet, allowed us to increase our regular dividend 10% and go-forward cash return commitment to a minimum 70% of annual free cash flow.
“EOG’s business has never been better, and our financial position has never been stronger. Our 2024 plan demonstrates our consistent focus on improving the cost structure of our company. The depth of resource across our multi-basin portfolio of premium assets provides long-term visibility for high returns and strong free cash flow generation. Our confidence in EOG’s ability to compete across sectors, create value for our shareholders, and be part of the long-term energy solution has never been higher.”
Fourth Quarter 2023 Financial Performance
Prices
- Crude oil and NGL prices decreased, partially offset by an increase in natural gas prices from 3Q
Volumes
- Oil production of 485,200 Bopd was above the guidance midpoint and up from 3Q
- NGL production was above the guidance midpoint and up 2% from 3Q
- Natural gas production was above the high end of the guidance range and up 7% from 3Q
- Total company equivalent production increased 3% from 3Q
Per-Unit Costs
- Gathering & processing, G&A, and DD&A expenses increased in 4Q compared with 3Q, while LOE and transportation costs decreased
Hedges
- Mark-to-market hedge gains increased GAAP earnings per share in 4Q compared with 3Q
- Cash received to settle hedges decreased from 3Q, lowering adjusted non-GAAP earnings per share
Free Cash Flow
- Cash flow from operations before changes in working capital was $3.0 billion
- EOG incurred $1.5 billion of capital expenditures
- This resulted in $1.5 billion of free cash flow
Cash Return and Working Capital
- Paid $479 million in regular dividends
- Paid $866 million in special dividends
- Repurchased $300 million of stock
- Changes in working capital and other items accounted for approximately $100 million of the increase in cash
Full-Year 2023 Financial Performance
Prices
- Crude oil prices decreased 19%
- NGL prices decreased 37%
- Natural gas prices decreased 60%
Volumes
- Crude oil production increased 3% to 475,800 Bopd
- NGL production increased 13%
- Natural gas production increased 14%
- Total company equivalent production increased 8%
Per-Unit Costs
- DD&A, transportation costs, and gathering & processing costs decreased in 2023, partially offset by higher LOE and G&A
Hedges
- Lower commodity prices in 2023 were partially offset by net mark-to-market hedge gains and lower net cash payments to settle hedges than 2022
Free Cash Flow
- Cash flow from operations before changes in working capital was $11.1 billion
- EOG incurred $6.0 billion of capital expenditures
- This resulted in $5.1 billion of free cash flow
Cash Return and Working Capital
- Paid $1.9 billion in regular dividends
- Paid $1.5 billion in special dividends
- Repurchased $971 million of stock
- Repaid $1.25 billion of debt upon maturity
Fourth Quarter 2023 Operating Performance; Cash Return
Lease and Well
- QoQ: Generally flat
- Guidance Midpoint: Lower primarily due to water handling costs and workovers
Transportation
- QoQ: Generally flat
- Guidance Midpoint: Lower primarily due to natural gas transportation
Gathering and Processing
- QoQ: Increased primarily due to fuel costs
- Guidance Midpoint: Generally flat
General and Administrative
- QoQ: Increased primarily due to professional fees and employee-related expenses
- Guidance Midpoint: Higher primarily due to professional fees and employee- related expenses
Depreciation, Depletion and Amortization
- QoQ: Increased primarily due to well mix
- Guidance Midpoint: Lower primarily due to the addition of lower cost reserves
Regular Dividend and Fourth Quarter Share Repurchases
The Board of Directors today declared a dividend of $0.91 per share on EOG’s common stock. The dividend will be payable April 30, 2024, to stockholders of record as of April 16, 2024. The indicated annual rate is $3.64 per share.
During the fourth quarter, the company repurchased 2.4 million shares for $300 million under its share repurchase authorization, at an average purchase price of $123 per share.
For full-year 2023, the company repurchased 8.6 million shares for $971 million under its share repurchase authorization, at an average purchase price of $112 per share. EOG has $4.0 billion remaining on its current repurchase authorization.
2023 Reserves
Finding and Development Cost
Finding and development cost, excluding price revisions, increased in 2023 to $7.20 per Boe, due to lower year-over-year revisions other than price and cost inflation. Proved developed finding cost, excluding price revisions, was $10.50 per Boe (GAAP) and $9.35 per Boe (Non-GAAP) in 2023.
For the 36th consecutive year, internal reserves estimates were within five percent of estimates independently prepared by DeGolyer and MacNaughton.
Reserve Replacement
Total proved reserves increased 6% in 2023. Extensions and discoveries added 607 MMBoe of proved reserves in 2023. Revisions other than price increased proved reserves by 139 MMBoe. Net proved reserve additions from all sources, excluding price revisions, replaced 202% of 2023 total production.
2024 Capital Program and Brent-Linked Gas Sales Agreement
2024 Capital Program
Total expenditures for 2024 are expected to range from $6.0 to $6.4 billion, including exploration and development drilling, facilities, leasehold acquisitions, capitalized interest, dry hole costs, and other property, plant and equipment, and excluding property acquisitions, asset retirement costs and non-cash exchanges and transactions. The capital program also excludes certain exploration costs incurred as operating expenses.
The disciplined capital program allocates approximately $4.3 billion to drill and complete 600 net wells in EOG’s domestic premium areas. Strong capital efficiency delivers 3% oil volume growth and 7% total volume growth, for ~$100 million lower year-over-year total direct investment in drilling and completion activity. The plan is anchored by steady year-over-year activity levels across most of EOG’s premium plays, with a step up in activity in the Ohio Utica play.
The capital program also funds investment in environmental and infrastructure projects, including approximately $400 million in strategic infrastructure projects associated with EOG’s Delaware Basin and Dorado assets. These projects are expected to provide several long-term benefits to the company, including margin improvement through higher price realizations and lower operating costs.
Oil & Gas Accounts


Author: phinds